For those who are wondering, the Kubernetes application did not crash. No progress is lost as of writing this blog post. This blog is not in danger of dying so far so I guess the story can continue.
Last week I left off at the application finally getting shape, this week I will be working on some final pieces of the puzzle. One of those pieces is the dashboard that welcomes you when you enter the application. The dashboard is powered by Metabase, this piece of software allows you to use the application data to create pretty charts and graphs, mostly used for business related analysis.
After some trial and error on creating a Metabase deployment of my own, I found a handy little tool called Helm. With Helm you can use pre-made deployments called “charts” to deploy your application of choice on your Kubernetes cluster. Unlike my deployments, these charts have been tested and proved to be working by many professionals and users of the community. I quickly found a Metabase chart in the official documentation of Metabase. With this came the realisation that I might want to visit the official documentation of the software that I am using more often instead of trusting internet strangers.
Trying out solutions that you find on the internet feels like building a Death Star and hoping it doesn’t contain the flaws of one.
After changing the default configuration that came with the chart, a glorious fully functioning Metabase deployment came alive. Excited to check it out, I was sadly greeted with an empty dashboard on the home page. I dug in and tried to build some graphs but realising I have no experience in this, my excitement quickly came to a halt.
Luckily I had the ability to consult Jordy. Jordy is the original creator of the application that I am trying to integrate in Kubernetes. In this story he will be Bilbo Baggins handing the ring over to me, Frodo Baggins. Only this time I won’t try to destroy it.
With his help, we managed to create a cool looking dashboard filled with pretty looking graphs and charts. I would love to show you a picture of this dashboard but at the moment of writing this blog I may or may not have screwed it slightly up.
But, I still promise to deliver you a cool looking dashboard so, here it is.
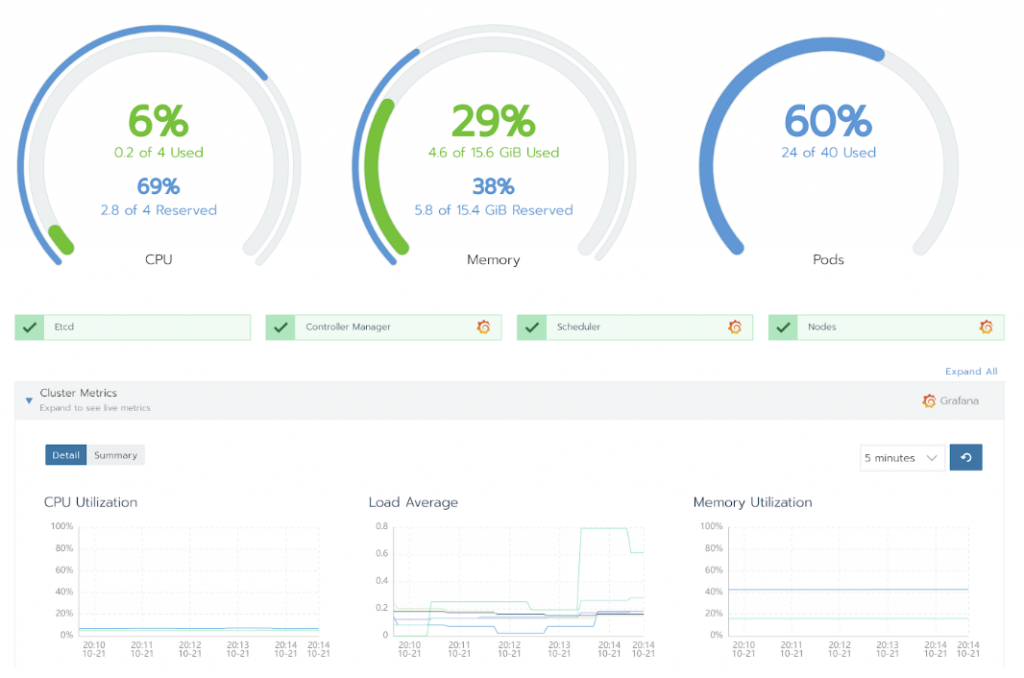
This isn’t the dashboard of the application itself but it’s still a really cool one, right? This dashboard actually monitors the Kubernetes cluster that we have running on AWS.
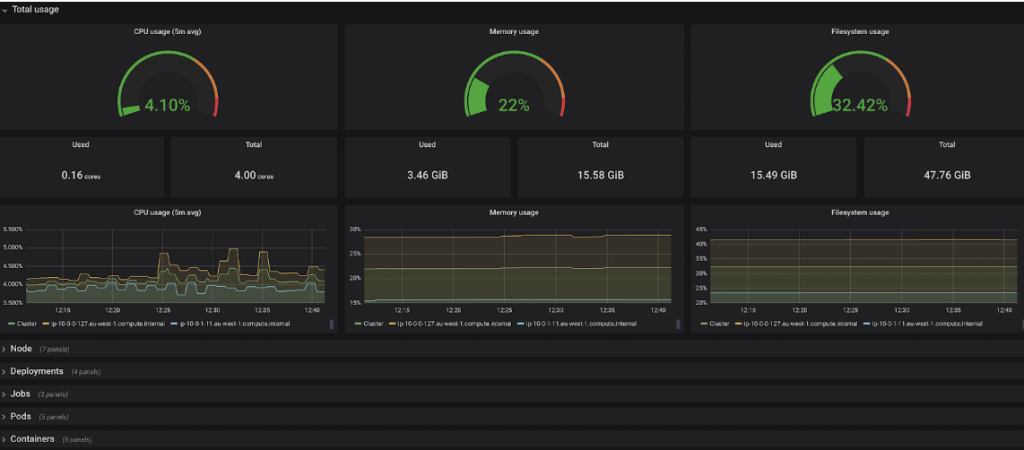
On this dashboard you can see the resource usage of the pods, you can detect anomalies that are happening within the system and it contains an event log to troubleshoot occurring errors. All the credits of this dashboard go to my mentor Bjorn. With Rancher he made it possible to monitor the cluster and get some handy information that is easier on the eyes.
Something I forgot to mention is that my internship mainly consists out of 2 parts. The first and most important part is the main project which is integrating the application into Kubernetes. The second part consists out of a research project where I have to find out which container repository will rule them all or which tool suits the best for the needs of Jidoka. A container repository tool is used to store and manage Docker images. For a company like Jidoka it’s an import part of their DevOps lifecycle. So I have been given the task to compare the best container repository tools and to find out which one would bring the most of use to Jidoka. This week I spend some more time working on this task.
The approach that I went for was to create a proof of concept that would mimic a small pipeline where I could build and deploy Docker images to various container repository tools.
I won’t bother you with the boring details but to keep it short, I made a Jenkins pipeline that pulls a simple Spring boot application from a GitLab repository. This application is build and packaged into a Docker image and sent to a couple of container repository tools. I will use these tools to compare all the features that they have to offer. The tools that I chose for my comparison are: Nexus, Artifactory, Harbor, Docker Hub, Amazon ECR. The last 2 are more cloud based tools but they still offer a Docker registry solution.
After spending some time on building the proof of concept, I could finally start documenting the first differences and features between the tools. To be honest, I did not expect some simple tools that are mainly used for storing container images, to contain such a variety of features. Some even have build-in vulnerability scanning, it just shows the importance of security in this day of age. Hopefully I get to do some security related tasks myself during the next week(s) of this project. Keep following this almost interesting blog and you might find out if I do.
Copyright 2025 JIDOKA BV, Motstraat 30, B-2800 Mechelen, BE 0543.452.396, RPR Antwerpen